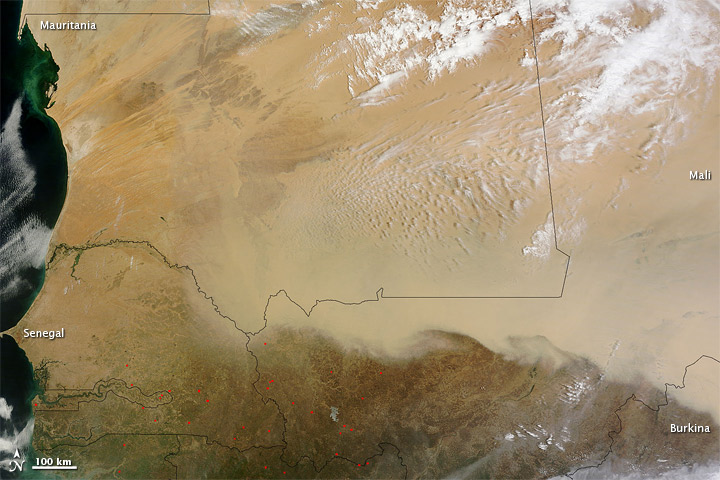
Dust Storm in the Saharan Desert

The Sahara Desert in northern Africa produces huge dust storms, which often can be difficult to see because the dust and land are often the same or very similar colors. The false-color Moderate Resolution Imaging Spectroradiometer (MODIS) image in this pair, acquired by the Aqua satellite on June 26, 2004, solves that problem, because it depicts the storm in terms of temperatures. While the land, portrayed in darker shades of red, runs from 45-67 degrees Celsius (113-152 Fahrenheit), the dust is significantly cooler. It appears in lighter shades of red, orange, and yellow, putting it in the 23-45 degree C (73-113 F) range. When the wind lifts the dust into the atmosphere, the dust cools, and makes it stand out in this Land Surface Temperature (LST) product image. Clouds, which are by nature cold and sometimes icy, appear as blue and purple blotches.
The land surface temperature image also helps show how large the storm is. It stretches at least across a good 500 kilometers of the Algeria-Mali border (lower left), and quite far into each country. In the true-color image, the outer edges of the storm aren’t as noticeable, because the dust is much thinner and harder to see. But in the LST image, the cooler dust is plainly visible. Rising and falling air makes ripples in the air-borne dust. The ripples are visible in the true-color image, but their structure is more distinct in the temperature image.
The surface temperature image was generated based on a stream-lined version of the MODIS Land Surface Temperature product.
Credit: Jeff Schmaltz, MODIS Rapid Response Team, NASA/GSFC


