
Cosmic map reveals that the Milky Way's dust has very unusual properties
When astronomers observe distant objects, there is a potential pitfall: does a particular star truly appear reddish because of its intrinsic characteristics, or is it merely taking on a red hue due to intervening cosmic dust?
For astronomers, dust is not just an observational inconvenience – it also provides crucial insights into the composition and local conditions within interstellar space.
Two researchers at the Max Planck Institute for Astronomy (MPIA) have now created the most detailed three-dimensional map to date, tracking dust in our galaxy and explaining how it alters light along our line of sight.
Why dust matters for observations
The dust spread across the Milky Way dims and reddens the light from distant stars. When light from a star travels to us, the tiny dust particles more strongly absorb and scatter bluer wavelengths, while allowing redder wavelengths to pass more easily.
This wavelength-dependent phenomenon is referred to as extinction (the star appears fainter than it is) and reddening (the star takes on a redder hue).
Accurately disentangling the effect of dust is vital for astronomers, who need a precise picture of distant objects’ actual brightness and color to glean information about their properties.
As Xiangyu Zhang, a doctoral candidate at MPIA, and his advisor Gregory Green explain, cosmic dust particles don’t absorb and scatter light evenly across all wavelengths, but rather they absorb light more strongly at shorter wavelengths, towards the blue end of the spectrum, and less strongly at longer wavelengths, towards the red end.
Studying these dust properties can shed light on the composition and evolution of the interstellar medium.
Mapping dust across a galaxy
Previous efforts at mapping dust on a galaxy-wide level were limited, mainly due to incomplete data.
The European Space Agency’s Gaia mission – devoted to tracking positions, motions, and physical traits for over one billion stars – now offers a treasure trove of new information.
Gaia’s third data release (DR3), published in June 2022, contains 220 million spectra. Zhang and Green identified 130 million of them as suitable for their study of dust’s effects.
Gaia’s spectra, however, are low-resolution, meaning they only separate incoming light into broad wavelength bins.
To improve accuracy, the researchers turned to high-resolution data from the LAMOST survey for approximately 1% of the stars in their sample.
These extra details helped them determine each star’s surface temperature and other properties, crucial for untangling the effects of dust from the star’s own attributes.
Building a 3D dust map
Zhang and Green employed machine learning techniques – specifically, a neural network – to synthesize model spectra that incorporate both known stellar properties and dust parameters.
The researchers compared these model-generated spectra with the observed Gaia data, all while ensuring the results followed certain established laws of physics.
In doing so, they derived new constitutive models detailing how dust in different parts of the galaxy dims and reddens starlight (often represented by an “extinction curve”).
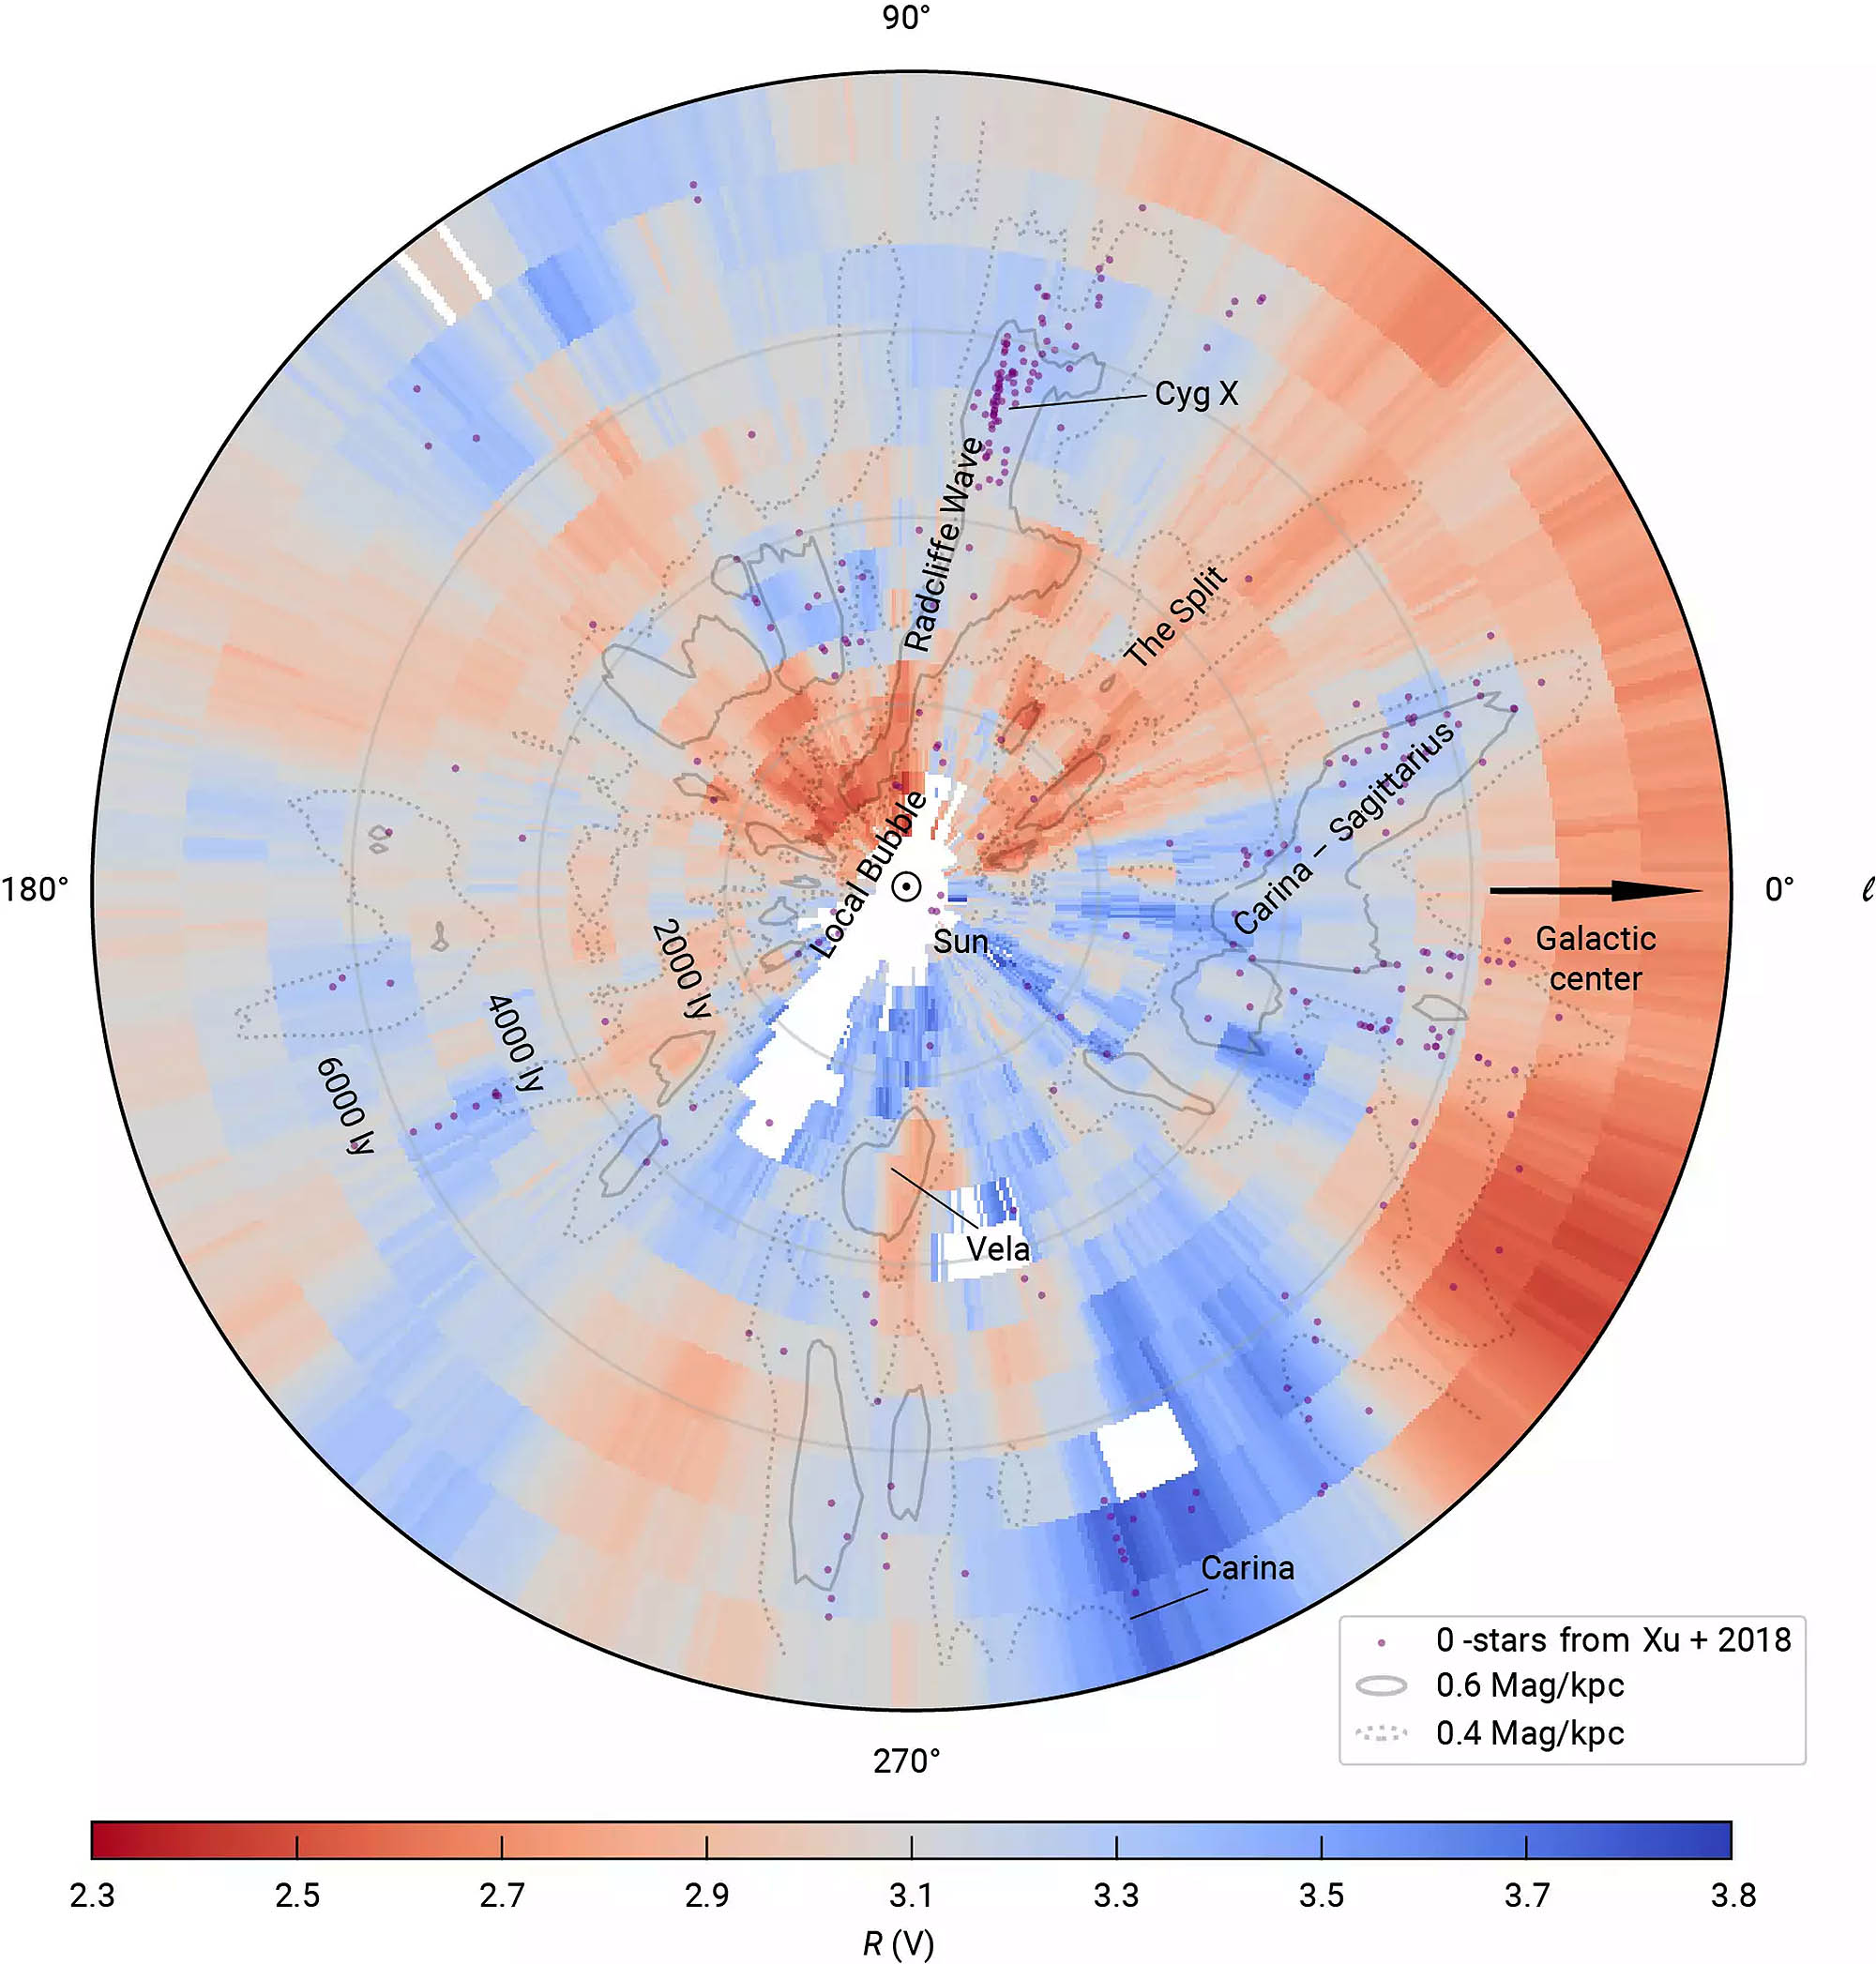
Through statistical analyses, the experts could reconstruct the properties of dust along each star’s line of sight, culminating in the most finely detailed 3D map of dust across the Milky Way yet produced.
Stellar birth and planet formation
Dust is sometimes seen as “the astronomer’s enemy,” as it confounds easy measurements of stellar brightness and color. Yet it also lies at the core of stellar birth and planet formation.
Stars emerge from massive molecular clouds, which are shielded from harsh external radiation by dust. Newly formed stars are surrounded by disks of gas and dust that seed planetary systems.
Moreover, much of the chemical richness in our galaxy, especially elements heavier than hydrogen and helium, remain locked in dust grains.
Surprising dust behavior
One of the map’s key findings contradicts earlier expectations. Astronomers once assumed that in regions of higher dust density, dust growth would flatten the extinction curve, making it less sensitive to wavelength.
Instead, Zhang and Green found that in areas of intermediate density, the extinction curve steepens, with shorter wavelengths more readily absorbed than longer ones.
“Higher density,” they note, is still extremely low by human standards – roughly ten billionth billionth grams of dust per cubic meter.
One plausible explanation is that certain molecules, especially polycyclic aromatic hydrocarbons (PAHs), might flourish in these conditions, causing the steeper wavelength dependency.
PAHs, which are the most widespread hydrocarbons in space, have even been proposed as a possible precursor to life.
First 3D map of dust in the Milky Way
Zhang and Green’s work constitutes the first detailed, three-dimensional map of the extinction curve of dust in the Milky Way, relying on 130 million measurements compared to around one million in past studies.
The success of this research demonstrates how advanced techniques – merging big data and rigorous physics – can unearth new insights.
Though their results provide an unprecedented view of dust’s large-scale distribution and properties, questions linger about how dust forms and evolves in different parts of the galaxy, and how these changes might influence the births of stars and planetary systems.
Zhang and Green intend to test their PAH hypothesis with future observations, refining the model to capture finer structural details and verifying the presence of specific molecular signatures.
In a broader sense, the study’s methodology promises to refine how astronomers correct for dust’s interference in both local and cosmological observations.
It may also help interpret new data from upcoming missions that probe the Milky Way’s structure and chemical makeup.
Consequently, the refined 3D dust map offers a clearer, dust-corrected view of our galaxy’s layout – an essential foundation for everything from measuring star distances to unraveling the riddle of how cosmic matter is assembled into complex, life-enabling systems.
—–
Like what you read? Subscribe to our newsletter for engaging articles, exclusive content, and the latest updates.
Check us out on EarthSnap, a free app brought to you by Eric Ralls and Earth.com.
—–


